by Alan Bennetts, owner, Bay Systems
The transducers mounted in the smart tire must be low cost if the tire is to remain affordable. The challenge with low cost is that it is often the partner of low reliability, low resolution and low accuracy, and if those attributes are fed to a CMS computer, it will amount to rubbish being fed in and the result will be, rubbish out. It would seem reasonable, therefore, to look at the best possible signal that we could expect to get from a smart tire transducer and determine if there is useful information in it.
To be truly useful, the smart tire transducer must capture the differences between road surfaces to allow the CMS to optimize the vehicle’s performance. The starting point for a feasibility investigation can be either two roads that differ widely or two similar road surfaces that nevertheless are different.
The CMS might either be in the business of fine-tuning the vehicle’s dynamics as surfaces change, or preventing a catastrophe by detecting water or ice. The time-constant for changes that fine-tune the vehicle dynamics cannot be short or aggressive for fear of making the vehicle feel restless and ill at ease on the road. However, to save the vehicle from losing control when encountering water/mud or ice, the time-constant must be short. We now have a contradiction in that a long time-constant for vehicle response would mean that dangerous changes in the road surface would not be ameliorated quickly and an accident might occur.
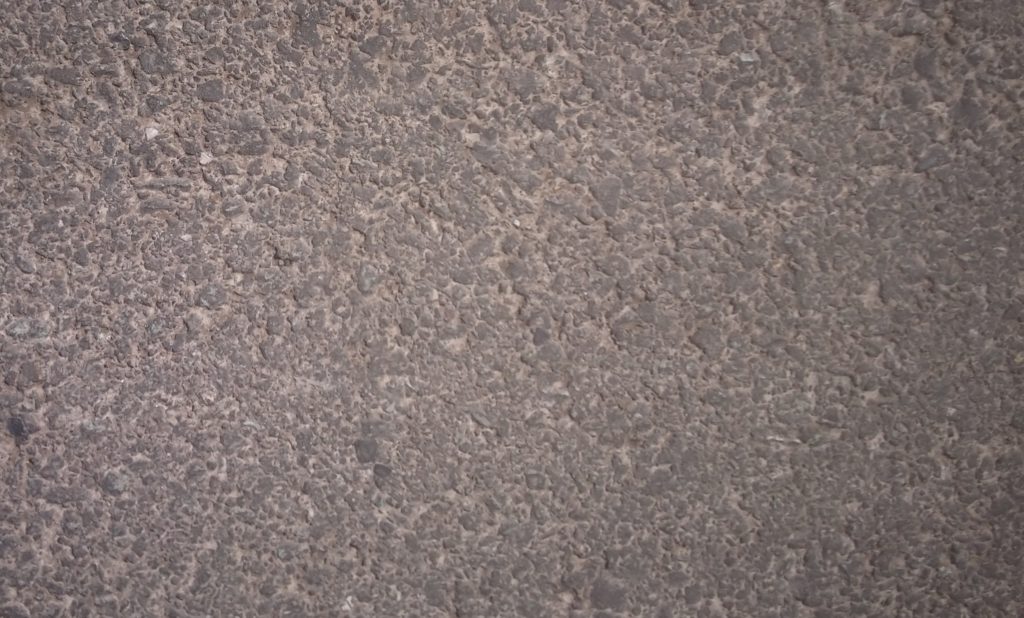
I have selected two common road surfaces for this initial measurement. The first is 20-plus year-old asphalt road located in the hamlet of Blakeway on the B3151 in the UK. It is heavily used by both light and heavy vehicles. The other is North Chine Drove a road that is arguably the smoothest piece of tar macadam in Somerset. It was laid some three years ago and is used infrequently by light vehicles and is so smooth that cyclists make a detour to ride on it. The condition of the two surfaces can be seen in Figures 1 and 2.
The example measurements were made using an instrumentation quality accelerometer mounted on the inner-liner of a 235/65 R17 all-season tire fitted to the rear axle of a Mazda BT50 pickup truck driving at a steady 50mph (80km/h) on both surfaces. The overview of the 20 seconds recorded on each surface is shown in Figure 3, North Chine Drove in blue overlain by Blakeway in red. There is nothing of significance or any obvious difference between the two signals.
Going to a point in the recording where the two contact patch transitions overlay perfectly, Figure 4 confirms that the contact patch transition acceleration is identical.
The pre-wave at Blakeway is 533Hz and North Chine is 406Hz for the tires rotating at 9.3121Hz (558.7rpm), but it is possible that this difference is unreliable, excited by bumps in the road or multiple circumferential modes existing (the more likely explanation).
A circumferential wave exists for both road surfaces at a point diametrically opposite the contact patch, i.e. on the top of the wheel. The frequencies are 449Hz for Blakeway and 406Hz for the North Chine Drove surface. The higher frequency is again found in the Blakeway data (see Figure 5).
The time-domain traces reveal nothing about the surfaces other than that they are effectively identical from the perspective of the spectra obtained from an accelerometer mounted on the inner-liner of a typical tire. Analysis in the frequency domain can sometimes reveal what is hidden in the time domain – but not this time. A 15-block average was taken using a 32k sample block size and standard FFT algorithm; the result is shown in Figures 6 to 9.
As we move to lower frequency region and the 1Hz resolution becomes visible we see the wheel rotation orders appear.
The orders for both surfaces are amplitude modulated with a null occurring every +/-160Hz, which is the reciprocal of the contact patch transition time of approximately 0.0067secs (see Figure 10).
The signals show the same profile for the 200° after contact patch (see Figure 11). In this case, the signal has been high pass filtered to remove most of the lower frequency wheel rotation orders.
The FFT result with 12Hz resolution for this recording made at the 8-second section of the recording (see Figure 12) again shows a near identical result.
An analysis technique where instantaneous frequency content is displayed as a color map, referred to as either, time frequency analysis or wavlet, can sometimes reveal structure hidden when using more conventional analysis, (see Figures 13a and 13b).
The bursts of color indicate that the frequencies present are variable in amplitude and the spread in the frequency at each instant indicates that the frequency itself is not stable. The two-color maps are scaled to the same pallet and level table, making the result directly comparable. The colors indicate a level spread from 50 to 200 units. The older, more worn Blakeway surface has the highest level peaks at 167 units, compared with the North Chine Drove peaks at 100 units, not significantly different.
Conclusions
There is no definitive difference between the time histories and spectra being generated by the two road surfaces. It is difficult, based on this initial sample of data from two different road surfaces, to see what a smart tire would send to the CMS that would be of any use in optimizing vehicle stability, or if such changes, if made, would be beneficial.
Figures 14a and b: Road surface photographs enlarged. Both are taken from the same elevation of 500mm
30mph (50km/h) on Somerset B roads
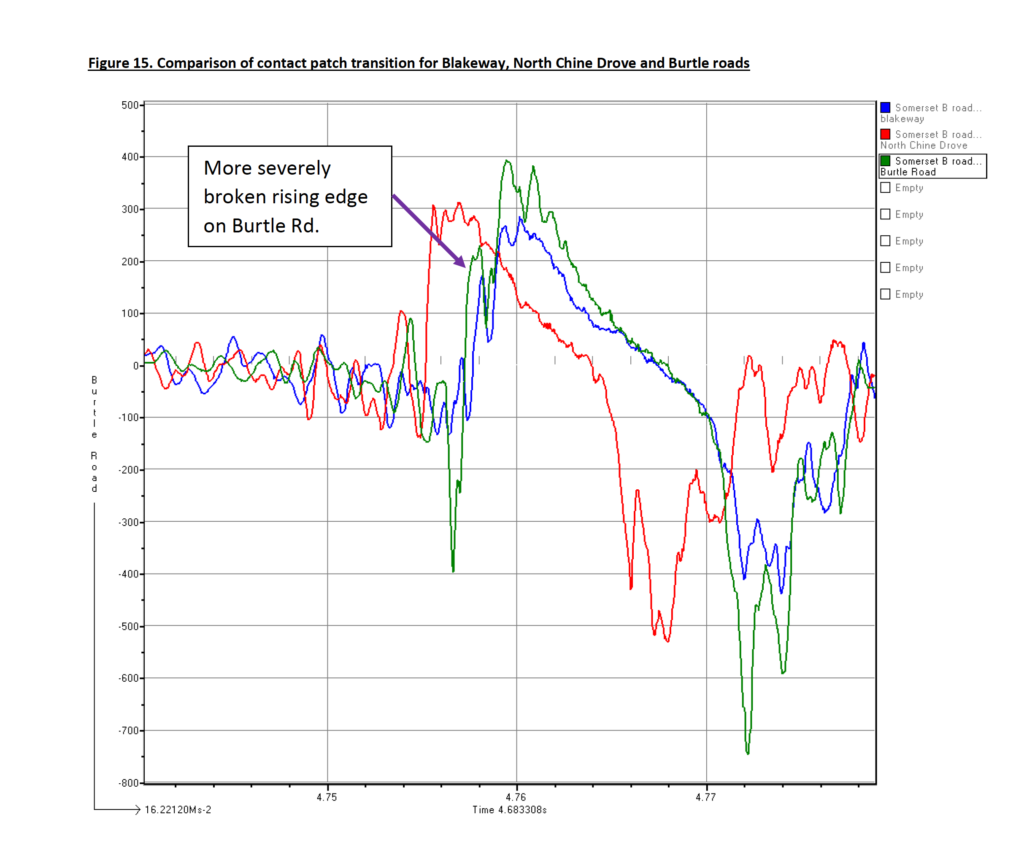
Both Blakeway and North Chine Drove road surfaces are intact i.e. the surface is not breaking up and does not have large cracks. The contact patch transition for these roads is shown in blue and red in Figure 15. The new addition is the Burtle road; this is a badly maintained and subsiding road with many cracks, shown in green in Figure 15. The more severely broken rising edge, shown in the trace, at the point the accelerometer enters the contact patch may be indicating the presence of a crack in this deteriorating road surface. However, the contact patch record at each transition is always slightly different for all three road surfaces. This allows almost any theory to be supported by judicious choice of data.
Figure 1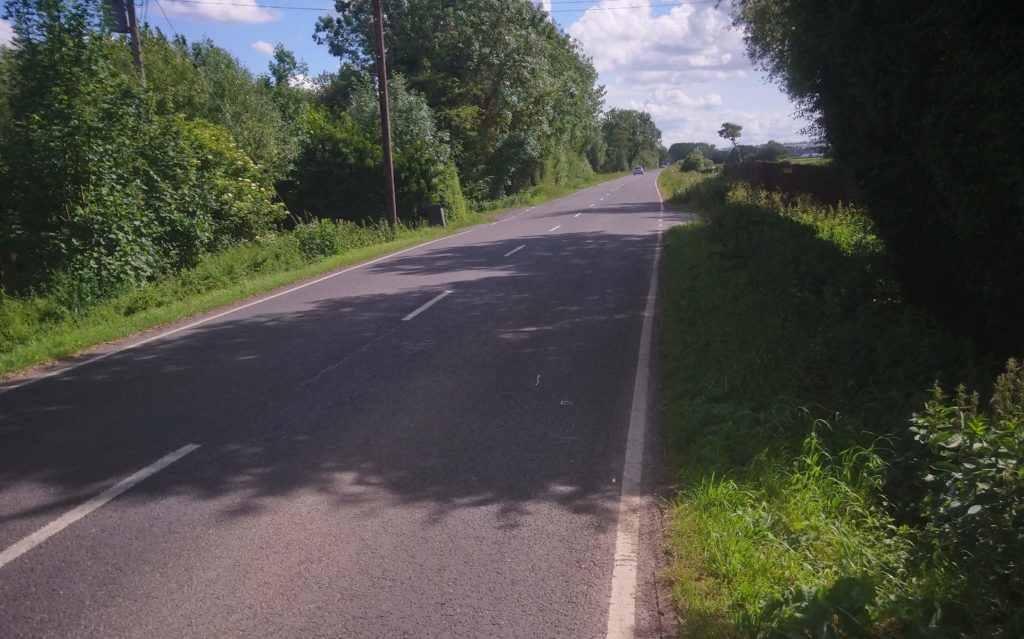
Figure 1b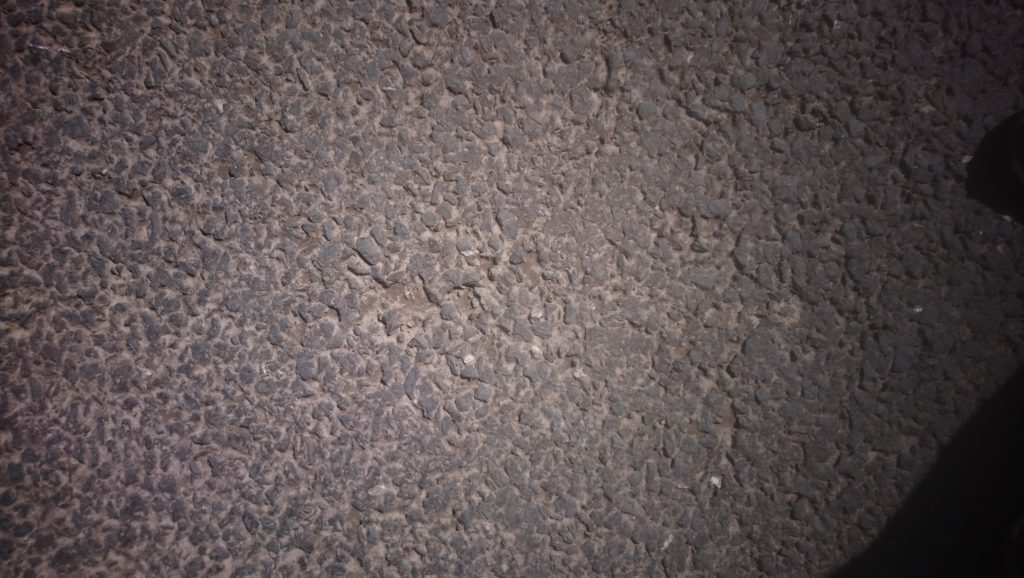
Figure 2a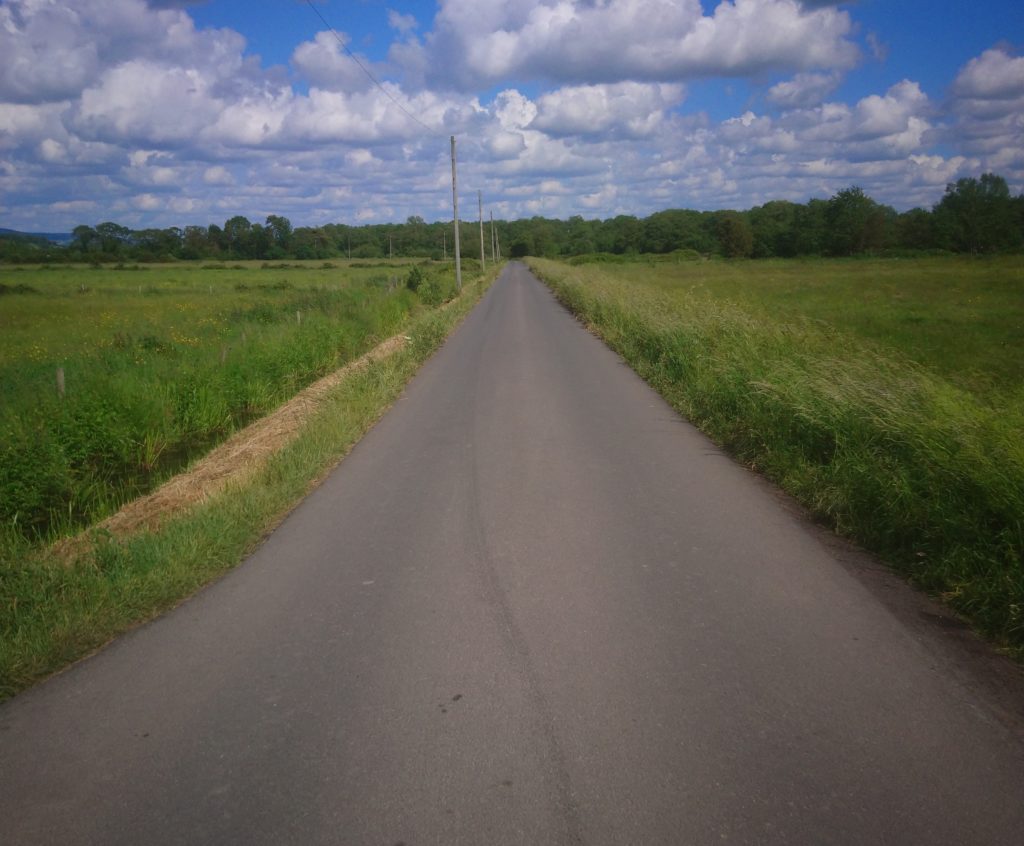
Figure 2b
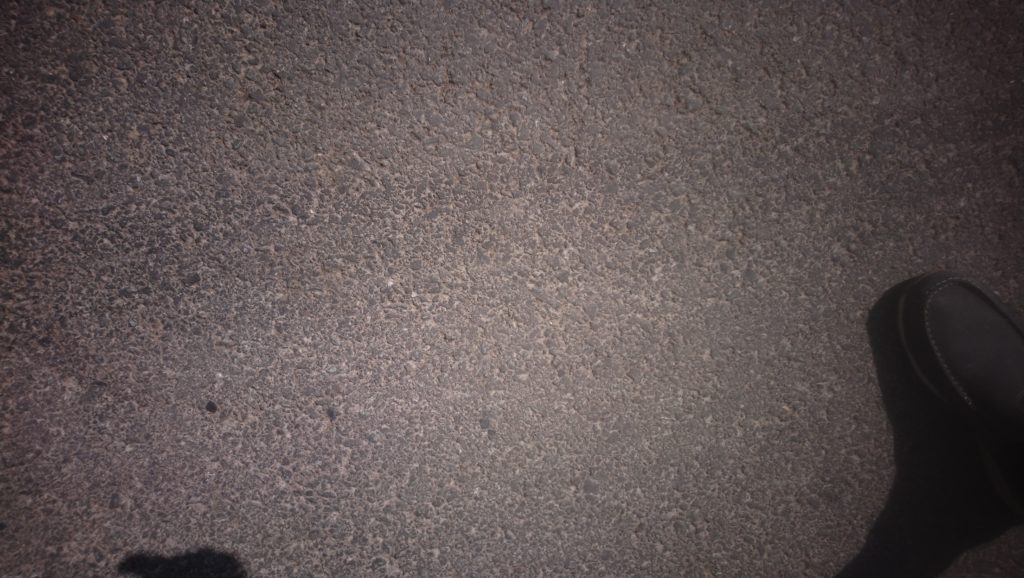
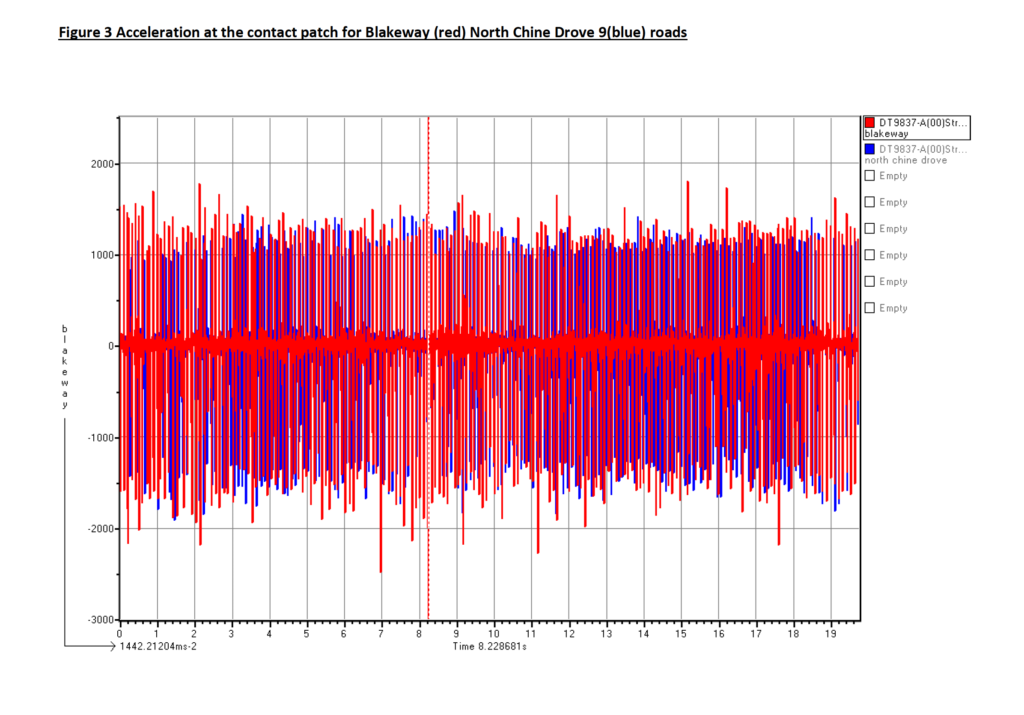
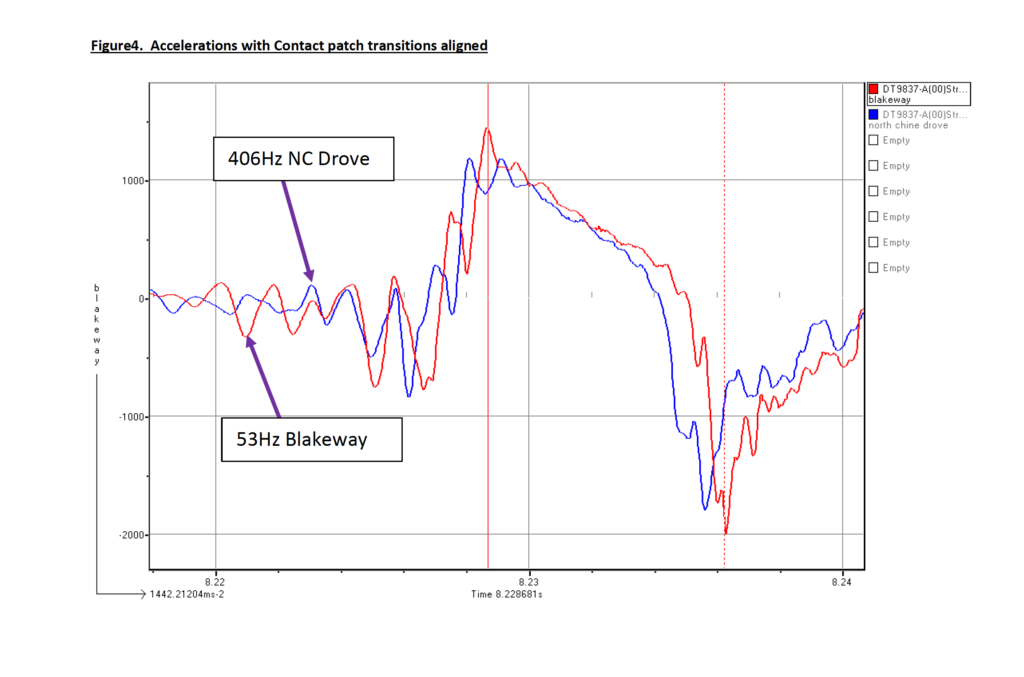
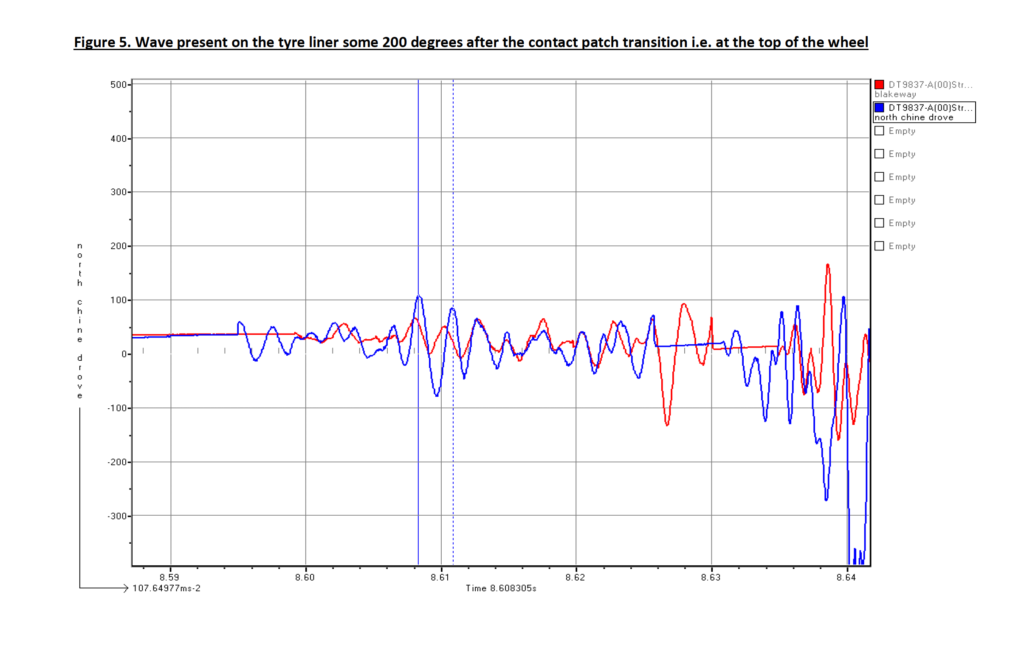
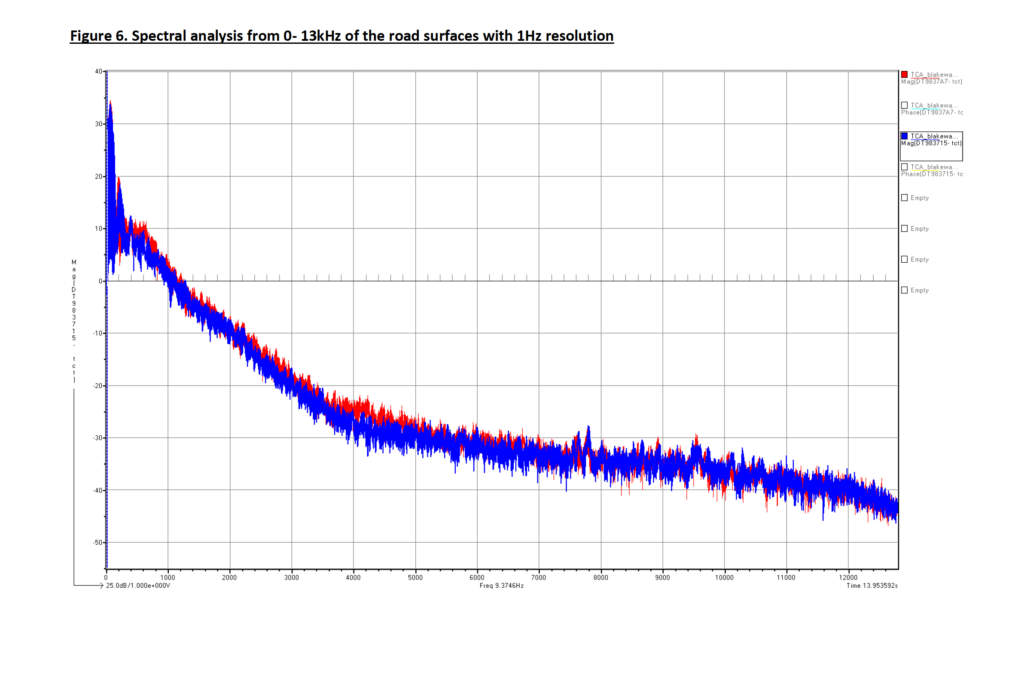
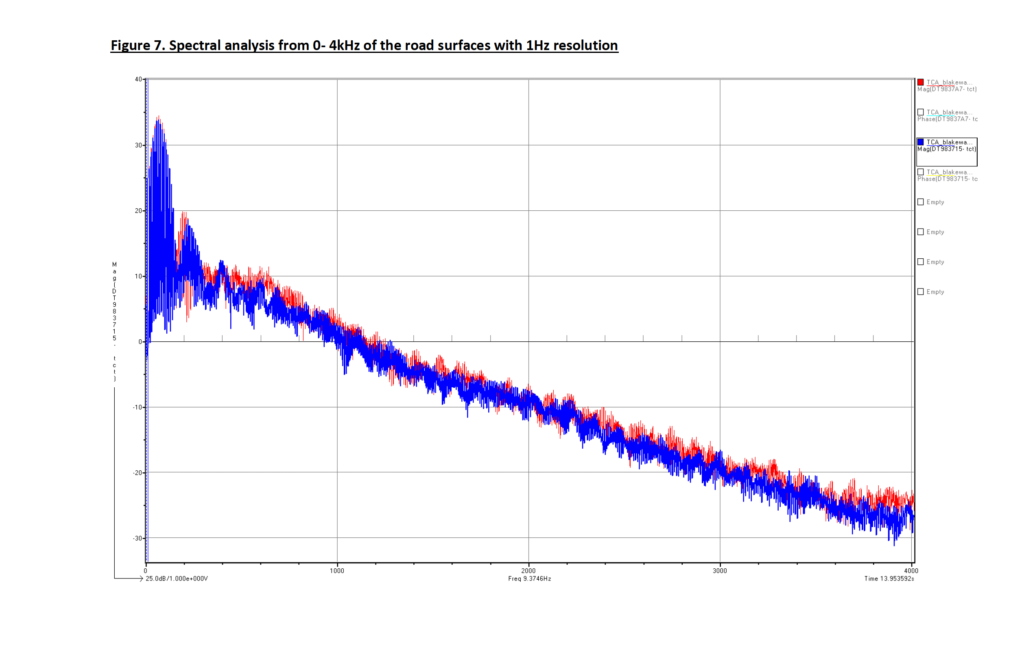
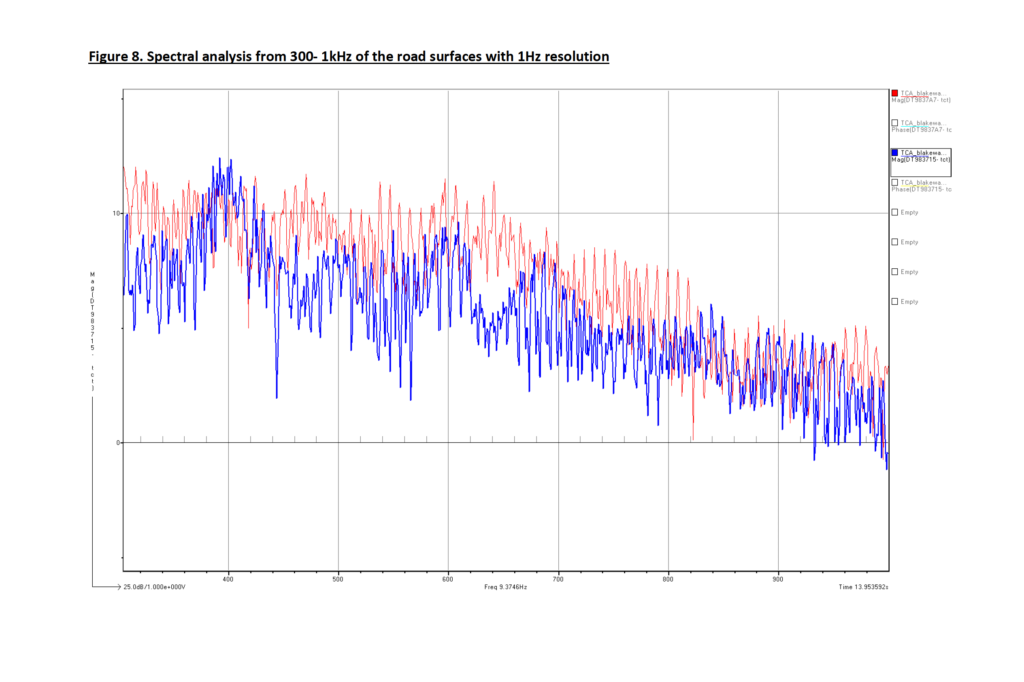
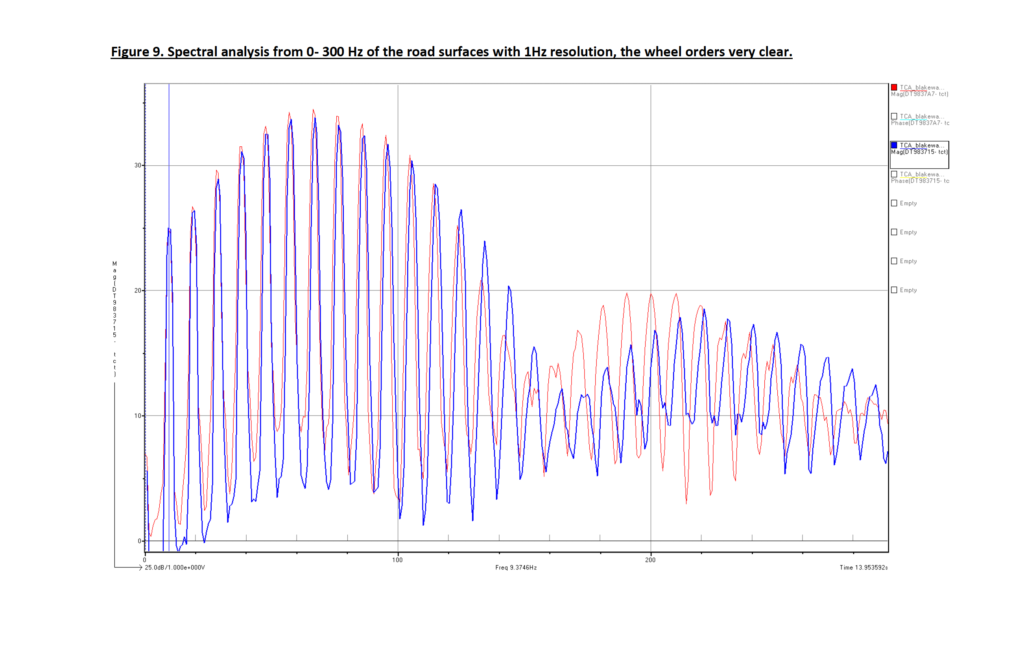
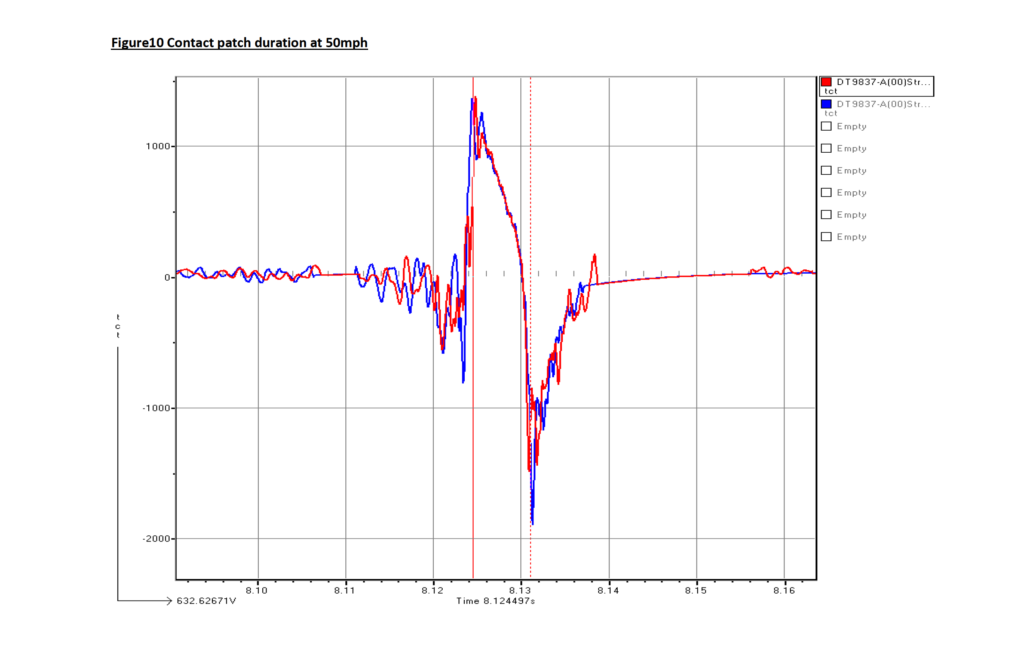
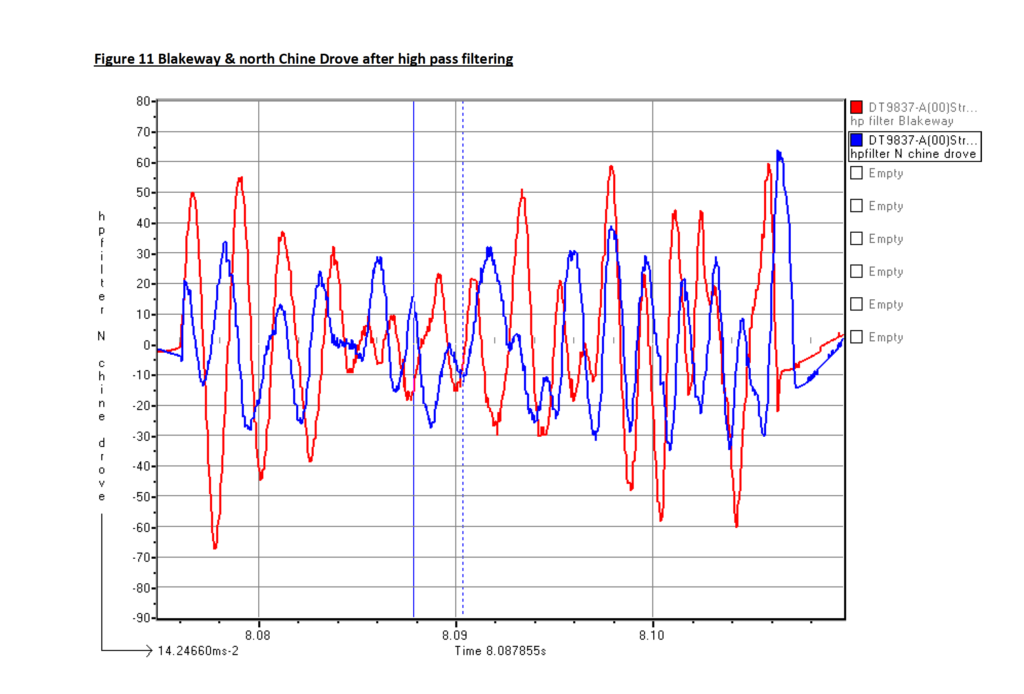
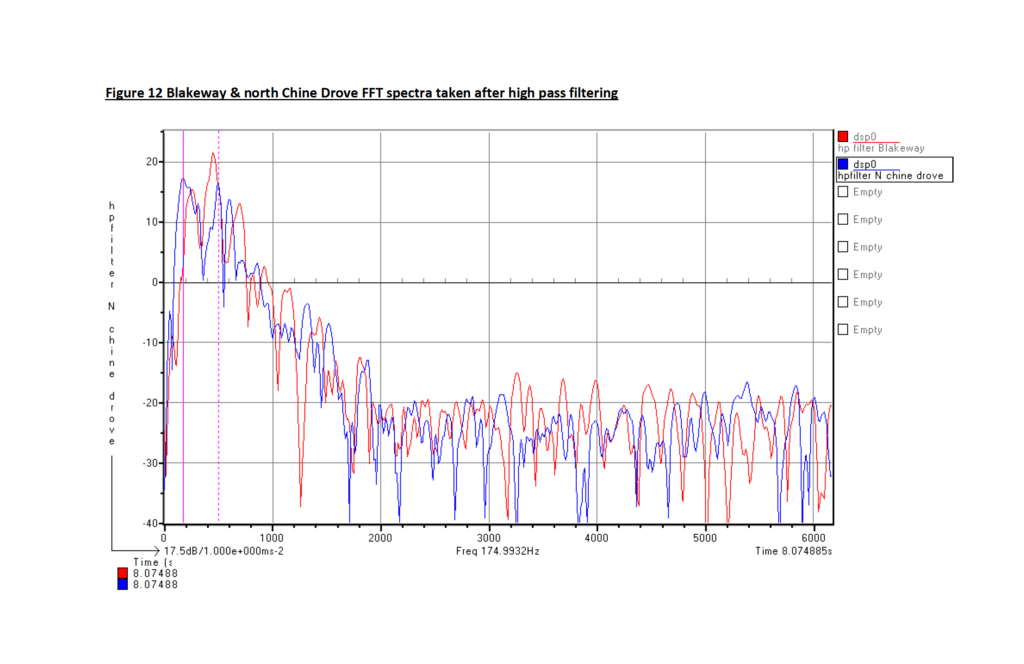
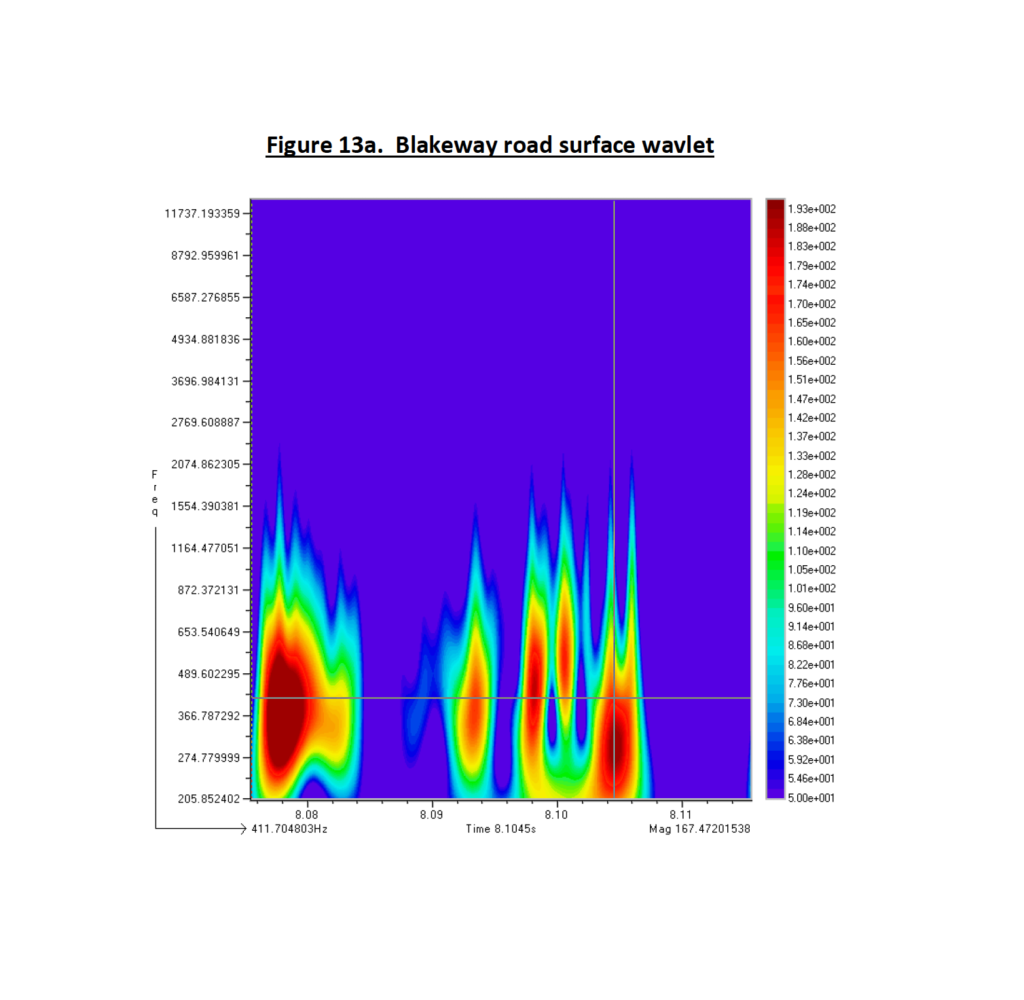
Figure 14a
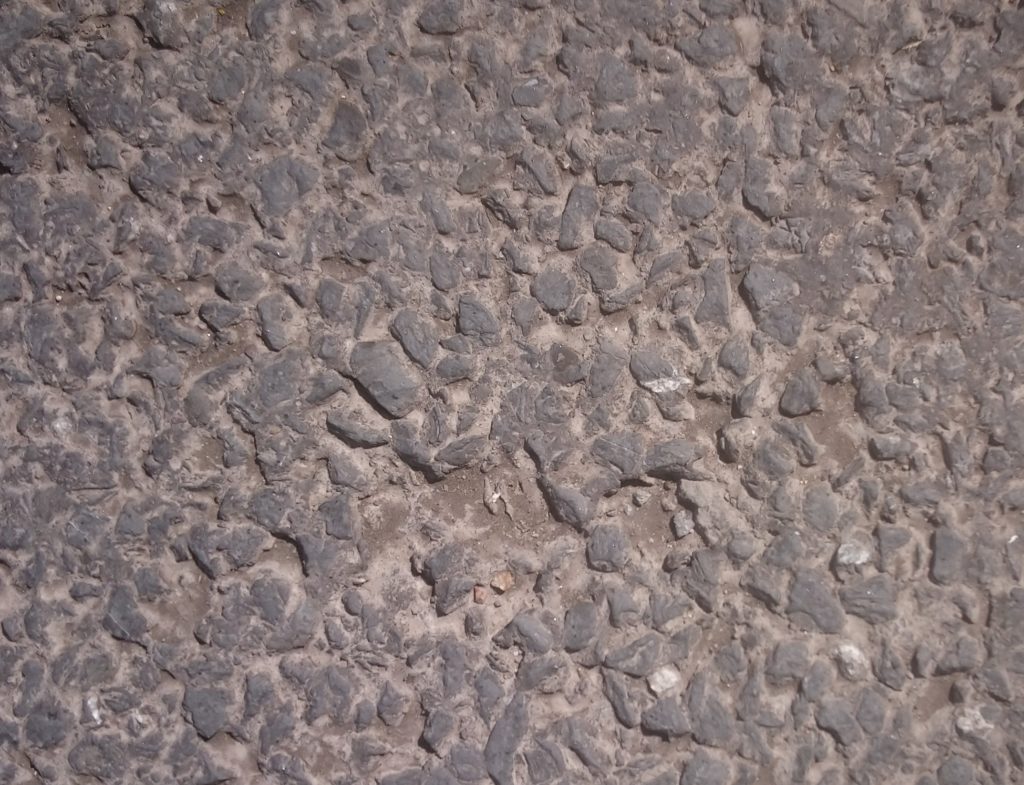
Figure 14b
